Strategy
Part of Product marketing strategy: the version that survives contact with reality
Product marketing strategy benchmarks, one decision at a time (2027 update)
Product marketing strategy benchmarks for 2027 name the sources, figures and cohort checks teams use to set adoption, demand and retention targets.
What to take away
- Benchmark adoption against a named cohort, not a competitor's launch post.
- Set the internal threshold from your own pilot; the external figure frames it.
- Record population, period, denominator and maturity window beside every number.
- Treat a benchmark as a range with a source date, never a single target.
- Stop the launch when qualified demand and durable use both miss the pilot range.
Benchmark sources and the figures they publish
Product marketing strategy benchmarks come from a few named publishers, and each one answers a different question. None is a target. Each is a comparison group with a stated population, so read the methodology page before you quote the number.
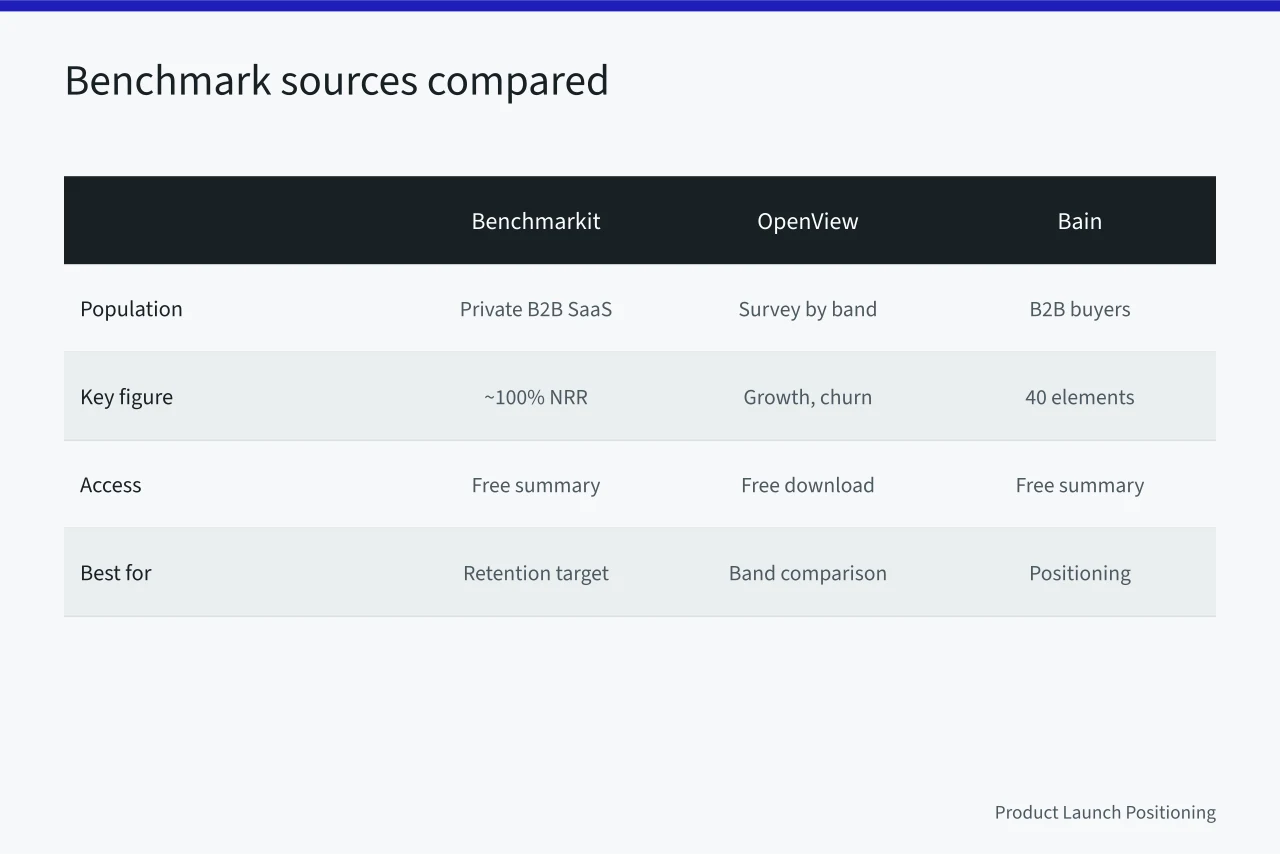
- Benchmarkit's SaaS Performance Metrics surveys private B2B SaaS companies. Median net revenue retention typically lands near 100%, median gross retention near 90%, and top-quartile net retention above 110%. Free summary, full report by request. Best for a net revenue retention target.
- OpenView Partners' SaaS Benchmarks Report, free to download, ran through 2023 and breaks growth, churn and expansion out by revenue band from a company survey. Treat those figures as a dated cohort. Best for B2B SaaS teams that need a band-level comparison.
- Bain & Company's B2B Elements of Value ranks 40 elements across five tiers, from table stakes to inspirational. The summary is free online. Best for positioning work where you rank claims by evidence strength.
- Product Marketing Alliance's State of Product Marketing report is free and covers team size, charter and launch cadence. Teams under about 100 employees typically run one to three product marketers, near one PMM for every three product managers. Best for sizing the function and defending headcount.
- Forrester, which absorbed SiriusDecisions, puts the typical B2B buying group at 6 to 10 stakeholders. Buying-journey research is paid, with free summaries. Best for mapping the buying committee.
- Gartner's B2B buying research reports that buyers spend about 17% of their purchase time meeting potential suppliers, and that buyer indecision stalls deals. Seats are quote-based and typically cost five figures a year. Best for win/loss work.
Forrester and Gartner sell annual subscriptions, typically in the tens of thousands of dollars for a small team. The Benchmarkit, OpenView, Bain and Product Marketing Alliance material is free, which makes it the cheaper first citation.
Reports refresh in the fall and winter. A 2027 plan drafted in spring 2026 needs the newest edition before sign-off.
Build a comparable benchmark
For each figure, record who is included, the period, the calculation and the currency. Also record the maturity window, the source and the uncertainty. Recalculate the number where the data allows.
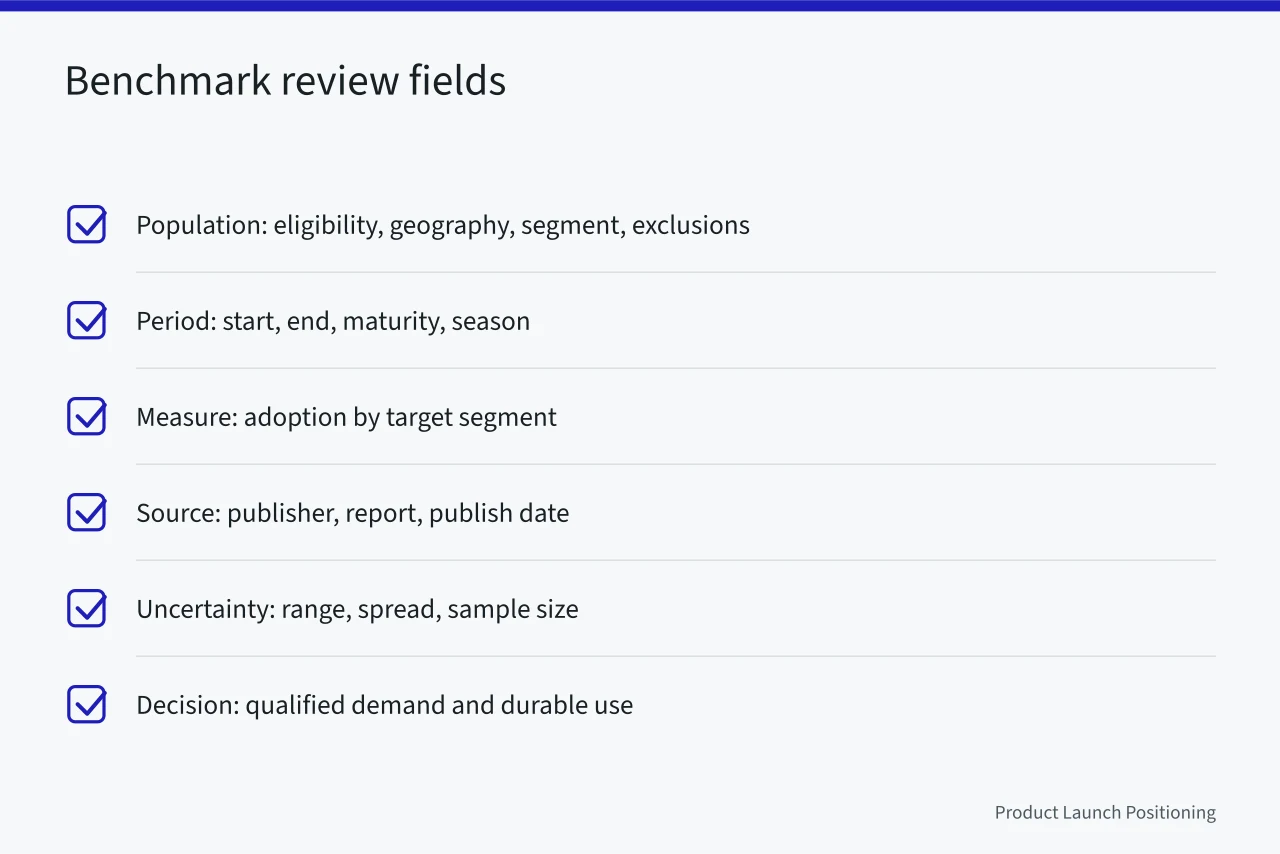
| Review field | What to record | Acceptance test |
|---|---|---|
| Population | Eligibility, geography, segment, exclusions | Comparable group |
| Period | Start, end, maturity, season | Comparable window |
| Measure | Adoption by target segment | Same definition and denominator |
| Source | Publisher, report name, publish date | Citable vintage |
| Uncertainty | Range, spread, sample size | Threshold with a margin |
| Decision | Qualified demand and durable product use | Threshold plus uncertainty |
Use one benchmark per decision. Two sources quoted for the same decision usually means the comparison group is still unsettled.
A 2026 report on companies past Series B does not describe a pre-launch pilot. Write one sentence on why the comparison group is relevant, and one on the difference that makes it unsuitable as a target.
Set the charter before the number
The product marketing charter names the customer problem, the product promise and the target market. It also covers the buying process, delivery capacity and the commercial evidence. Write it once, then version it.
The working file carries the approved scope, exclusions, version, owner and decision date. When a benchmark contradicts the charter, the charter wins until someone changes it in writing.
Keep the evidence trail
The CISA business-system logging guidance explains why organizations retain and review event records. Keep access, change, failure and correction records for the launch. Logs show what happened; they do not prove a business result.
The GOV.UK open standards guidance ties open standards to interoperability and reduced supplier dependence. It governs UK public-service work, so treat it as a portability prompt only. Record the source date beside the decision it informed.
Test the result before expanding
- Use a defined population and comparison basis
- Track adoption by target segment with quality and cost
- Observe one normal path and one failure path
- Preserve claims, inputs, versions and decisions
- Record uncertainty and rejected explanations
- Set a stop rule and a next review date
The NIST AI RMF Playbook lists voluntary actions grouped under govern, map, measure and manage. Apply them when AI changes a workflow. It is not certification and not a product ranking.
The GOV.UK technology selection guidance recommends adaptable choices, data control, security review and attention to ownership cost. Those questions suit a paid pilot without endorsing a vendor.
Worked example: a 2027 retention target
Say your pilot cohort is 40 accounts, the 90-day retention rate is 0.72, and the published range for your revenue band is 0.65 to 0.80. Your internal threshold sits at the low end of your own range, not the benchmark midpoint.
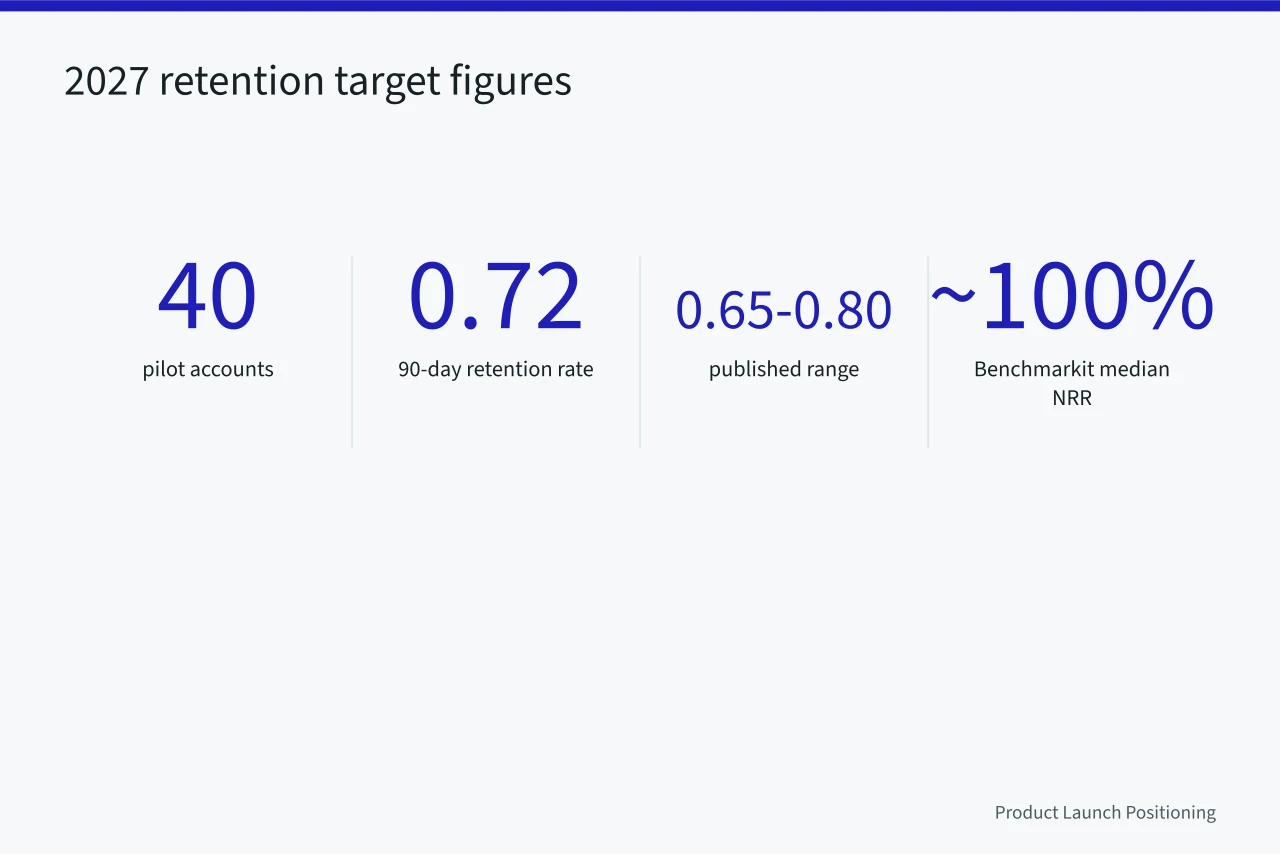
Benchmarkit's median net revenue retention near 100% covers a different window on a different cohort, so it cannot set your 90-day threshold.
Write it as: threshold = pilot rate minus the observed spread. Substitute your own figures. If the pilot spread is unknown, the threshold is not yet set.
Common questions
What is the first decision in product marketing strategy benchmarks?
Define the strategy owner, the audience, the outcome and the approved charter. Then name the evidence that would stop the work.
How should a benchmark be reviewed?
Review adoption by target segment with cost, quality, exclusions, source limits, failures and a dated decision record. Keep the external comparison separate from the internal threshold.
What should a team avoid?
Avoid activity disconnected from product evidence. Preserve the affected record and correct the public or internal output where the error appeared.
Which benchmark source should a team cite first?
Start with the free material: Benchmarkit for retention, OpenView for band-level history through 2023, Bain for value elements and Product Marketing Alliance for team size. Buy Forrester or Gartner seats when you need buying-group or deal-stall data.
Where does the product marketing strategy itself fit?
The product marketing strategy sets market choice, positioning and launch sequence. Benchmarks only tell you whether the numbers are plausible.